Hopalongs
Back, when the internet was still small and i was still a pupil I had an intense fascination with fractals. Among others, I worked on so called hopalongs. These are orbits of a special map. They were discovered by Barry Martin of Aston University in Birmingham. In 1986 they were popularized in the Scientific American by the well-known recreational mathematician Dewdney. The hopalong map is iteratively applied to a point (x,y) and the resulting points are plotted. The hopalong map takes three parameters, a, b, and c. Interestingly, the final image does not really depend on the starting point, but is very sensitive to changes in the parameters.
A previous collaboration of me on Hopalongs was with Schwebinghaus.
Back then, I programmed in Basic and bad Java, so I thought it would be a nice nostalgic experience to program hopalongs in Python. Below is the code and some nice images.
If you are capable of understanding German, you should also take a look here.
If you want to follow along with a jupyter notebook, you can download it from here.
import seaborn as sns
import numpy as np
def create_hopalong(a, b, c, n=5000):
    x = np.zeros(n)
    y = np.zeros(n)
    for i in range(n-1):
        x[i+1] = y[i]-np.sign(x[i])*np.sqrt(abs(b*x[i]-c))
        y[i+1] = a-x[i]
    return(x,y)
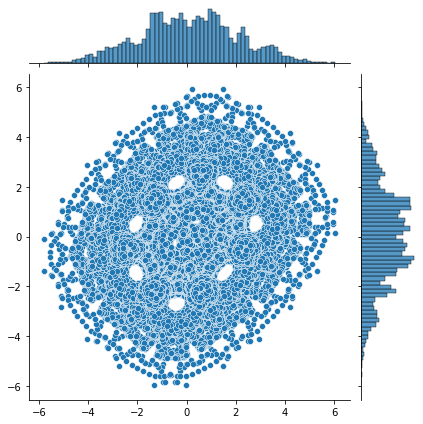
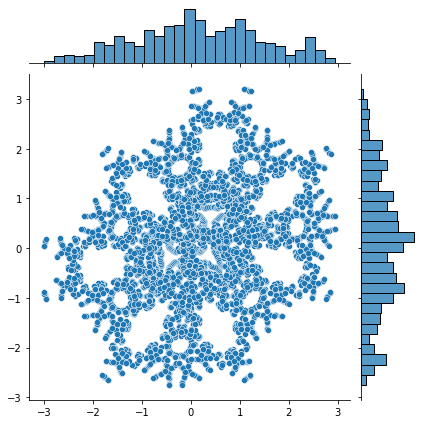
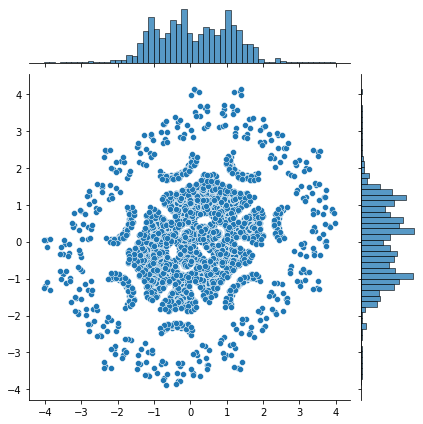
x,y = create_hopalong(0.7,1,0.3)
sns.jointplot(x=x,y=y)
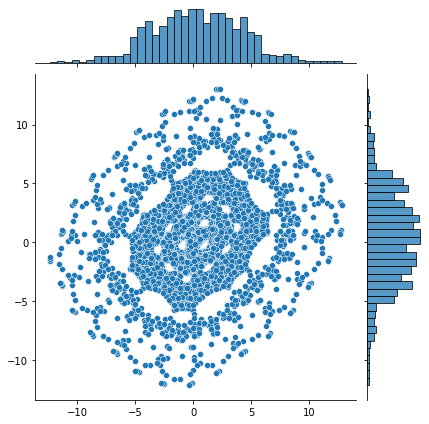
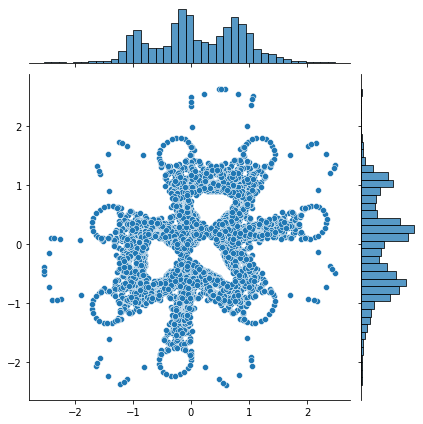
x,y = create_hopalong(0.7,0.3,0)
sns.jointplot(x=x,y=y)
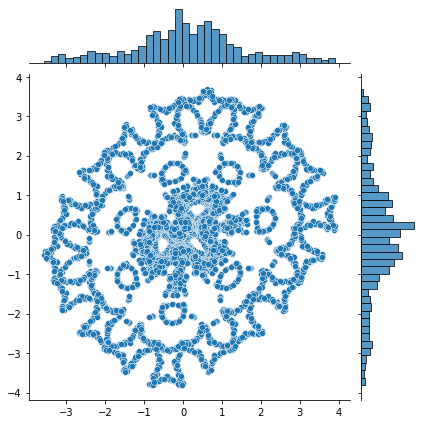
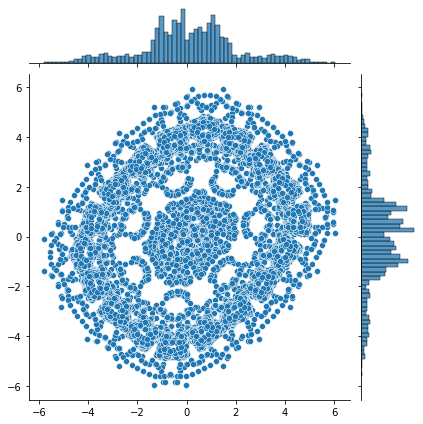
x,y = create_hopalong(0.5,0.3,0,100000)
sns.jointplot(x=x,y=y)
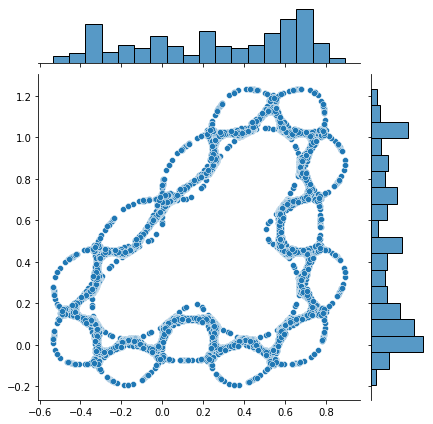
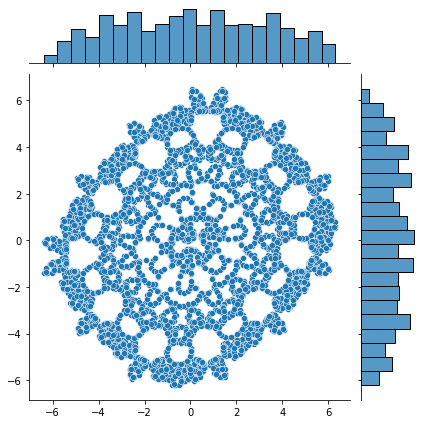
x,y = create_hopalong(0.2,0.3,0.2)
sns.jointplot(x=x,y=y)
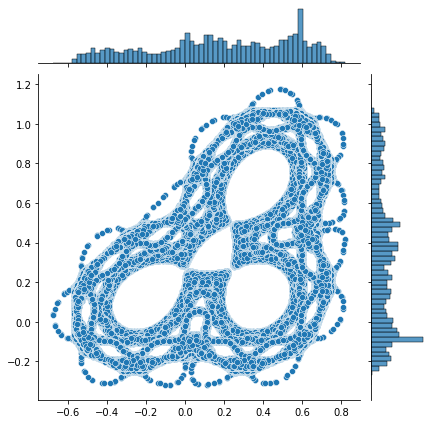
x,y = create_hopalong(0.1,0.3,0.2)
sns.jointplot(x=x,y=y)
x,y = create_hopalong(0.11,0.3,0.2)
sns.jointplot(x=x,y=y)
x,y = create_hopalong(0.111,0.3,0.2)
sns.jointplot(x=x,y=y)
x,y = create_hopalong(0.111,0.4,0.2, 10000)
sns.jointplot(x=x,y=y)
x,y = create_hopalong(0.111,0.4,0.2, 15000)
sns.jointplot(x=x,y=y)
x,y = create_hopalong(0.111,0.4,0.2, 30000)
sns.jointplot(x=x,y=y)